I will start by asking two questions. In addition to your answers and reasons, you may also imagine how the general public and your audience will respond.
Quiz
Question 1
In a factory manufacturing rods, the measurements of the rods are shown in the following graph:
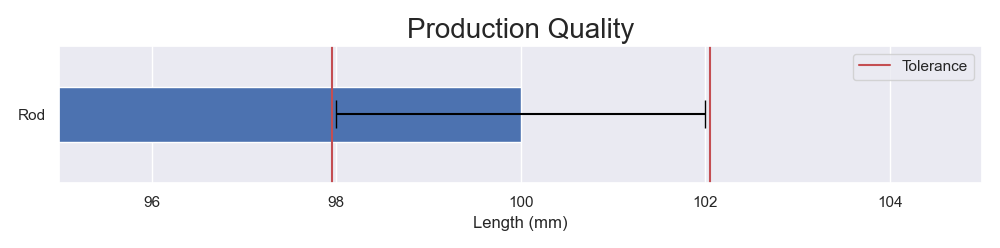
Measurements of the rods.
What is the quality?
- The quality is met.
- The quality is not met.
- There is insufficient information to tell.
Question 2
In a study of comparing two drugs, the effects are shown in the following graph:
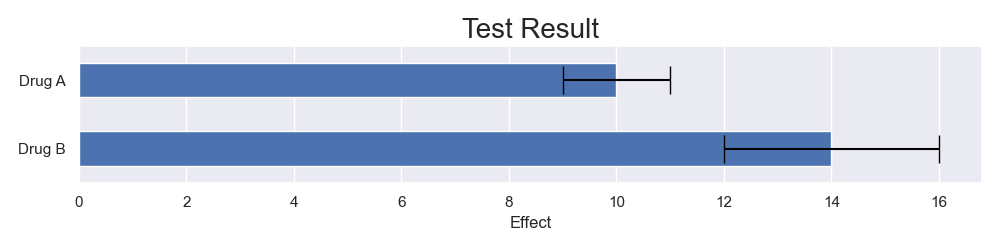
The effects of the drugs.
Which of the following is correct?
- The effect of drug B is significantly (p ≤ 0.05) different from drug A.
- The result is insignificant.
- It is too close to tell by looking.
- There is insufficient information to tell.
Answers
Click this to reveal the answsers.
Both the answers are "there is insufficient information to tell." Congratulation if you get them right. You have high enough graph literacy to dodge my traps. Do not worry if you do not get them. I will explain in detail below.
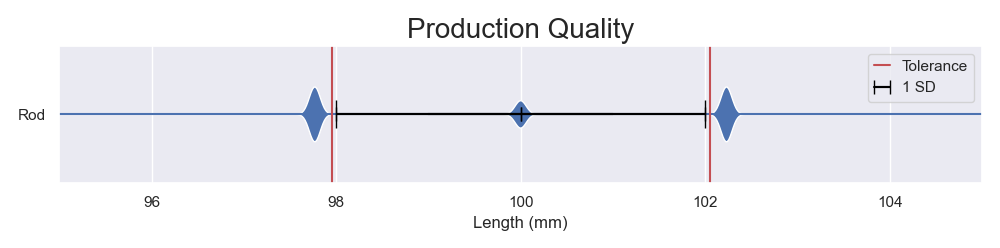
This is an extreme case of the measurements of the rods. The original error bar only shows ±1 standard deviation. There are 80% of the rods exceeding the tolerance.
Introduction
Randomness is an unavoidable part of the physical world. It is incomplete to talk about a physical quantity without its associated error. The pair is typical written in the form of "value ± error" for symmetric errors. In the form of a graph, it is popular to present an error with a bar. An error bar is a straight line with two caps at the end, signaling the size of the error. However, there are some intrinsic and extrinsic problems causing it to be an ineffective representation. Error bars hide important information, namely coverages and distributions. They frequently cover less than the ranges of the errors. Despite that they emphasize the values within, the values outside are usually still important. They are visually uniform, but the underlying distributions are not. Their annotations are typically outside their graphs, somewhere in the text.
All the source code plotting the graphs is available here.
Meaning of Error Bars
Error bars are graphical representations of errors. There are different kinds of errors, e.g., sampling errors, estimation errors, manufacturing errors, etc. Below is a summary of common quantifications of them.
| Depictions | Common Coverages |
|---|---|
| Standard Deviation | ±1 standard deviation |
| Standard Error | ±1 standard deviation |
| Confidence Interval or Credible Interval | 95% 99.7% 99% |
| Quantile | none |
Information Hiding
An error distribution can be in any shape. The middle of an error bar is only a line. It does not carry any information about the distribution. Even worst, it looks like a uniform distribution. It is only acceptable when all the following strict conditions are met:
- Everyone agrees with the boundaries.
- The bars show full ranges of errors.
- Only the boundaries matter.
Not agreeing with the boundaries does not render a result useless. Showing the distribution allows the audience to apply their criteria. In addition, a larger portion being further away from boundaries is practically better. There may be errors unaccounted for or future errors. Similarly, error bars are unhelpful when there are overlappings. Even if the overlapped ranges of different distributions are the same, the overlapped probabilities are generally different. When the audience does not have a certain degree of prior knowledge, they will use some guesswork to fill in the blank.
Inconsistent Coverages
The smaller the errors are, the better. Making them look smaller than they should is very tempting. Drawing only ±1 standard deviation is a common trick. At first glance, an error bar seems to suggest the audience to concern only about its range within. This coverage is rarely enough for real-world applications. For example, an error bar referring to ±1 standard deviation only covers 68% of samples for a normal distribution. The audience needs to extend the bars themselves, likely in their minds, if they know that they should. It may be easy to do so with one or two error bars but extremely challenging for multiple error bars or multi-way comparisons.
Alternatives
Violin plots are good alternatives. Their effectiveness was proven in the paper "Error Bars Considered Harmful: Exploring Alternate Encodings for Mean and Error"[1]. Violin plots use areas to present distributions. They leverage basic humans' visual skills in counting. As a result, the audience can judge the errors with a glance in simple cases. If error bars are drawn, they should be extended until meeting the criteria.
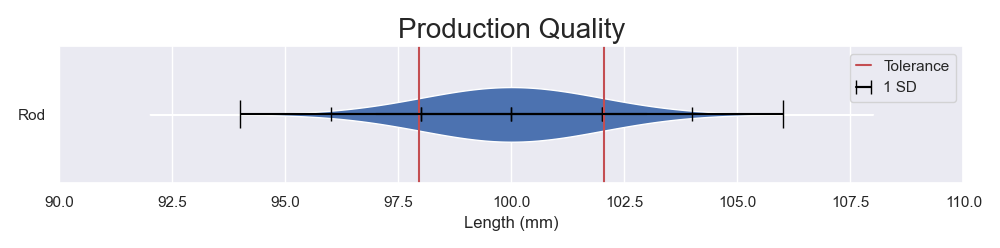
The graph in question 1 but being a normal distribution and was drawn as a violin plot.
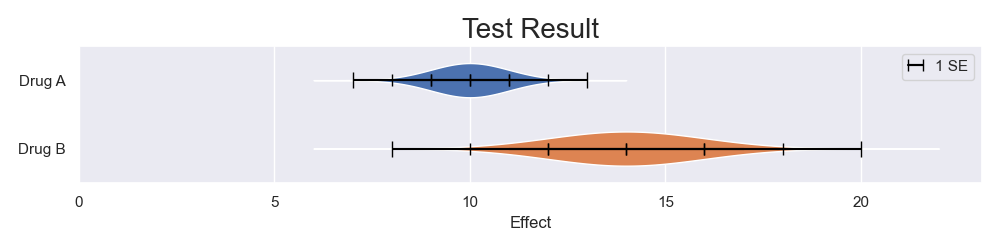
The graph in question 2 but was drawn as a violin plot. The widths are normalized to their corresponding probability mass functions, so the maximum widths are the same.
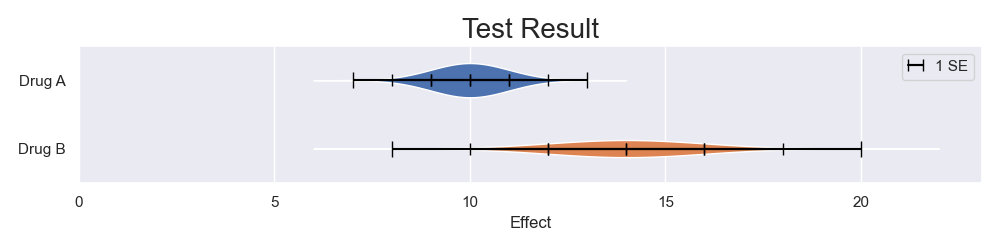
The graph in question 2 but was drawn as a violin plot. The widths are normalized to their corresponding cumulative distribution functions, so the areas are the same.
Gradient plots are other proven alternatives[1]. The audience understands that they represent fuzzy values without much explanation. The drawback is that it is difficult to draw and present them properly. Color is a complicated subject and hard to be done right. The graphs should accurately use colors to represent values. Otherwise, the audience will overweigh the values with unintentionally increased contrasts or vice versa. Typical software operates in non-linear perceptual color spaces. You are likely to draw perceptually distorted gradients. Besides, gradients in different colors give different visual contrasts. It is a problem if you use multiple colors. Furthermore, the audience may view the graphs with reduced contrasts or color distortions caused by poor conditions. They may view the graphs on incorrectly color-managed prints, using uncalibrated monitors, using projectors with environment light on, or viewing at large angles. There are likely 0.2% - 9% of your audience having color vision deficiency [2]. They may see reduced contrasts too. How much depends on how you draw your graphs. There are too many things to go wrong with gradient plots. Violin plots are clearer, simpler, and safer. It does not mean that gradient plots are inferior. There are trade-offs. It is just unfavorable to gradient plots. There exist situations where color accuracy is less of a problem, e.g., when the lengths of the gradients are short in a zoomed-out scale. In such cases, gradient plots may be good choices.
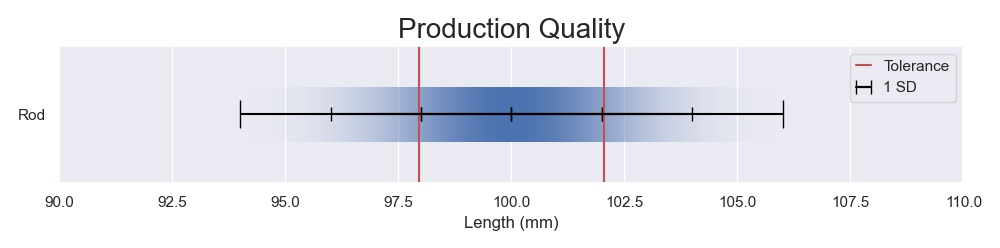
The graph in quesiton 1 but being a normal distribution and was drawn as a gradient plot. The gradient is drawn in a straight-forward way without careful color handling.
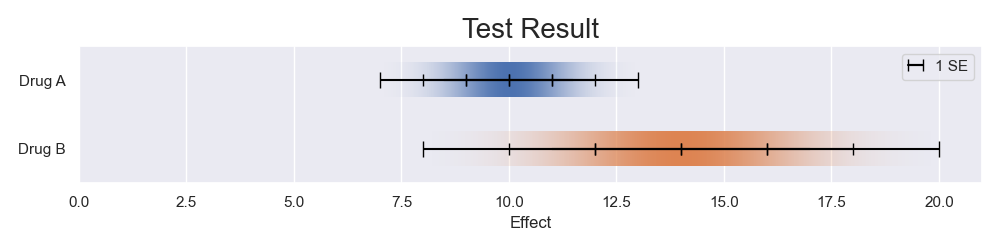
The graph in question 2 but was drawn as a gradient plot. The gradients are drawn in a straight-forward way without careful color handling. With a properly calibrated monitor, you should see that the orange bar disappears near 1/2 to 2/3 of the last standard deviations counting from the center.
Conclusion
Error bars are inadequate to display errors. They hide information and are frequently drawn short. In summary, they are deceptive. To communicate with your audience more effectively, I would suggest you adopt the following measures:
- Use violin plots.
- Draw the full coverages of the error criteria.
- Annotate the error bars in the graphs.
There are situations where gradient plots shine. However, gradient plots are tricky to draw and show right. You should consider the trade-offs carefully.
[1] M. Correll and M. Gleicher, "Error Bars Considered Harmful: Exploring Alternate Encodings for Mean and Error," in IEEE Transactions on Visualization and Computer Graphics, vol. 20, no. 12, pp. 2142-2151, 31 Dec. 2014, doi: 10.1109/TVCG.2014.2346298.
[2] Birch J. Worldwide prevalence of red-green color deficiency. J Opt Soc Am A Opt Image Sci Vis. 2012;29(3):313-320. doi:10.1364/JOSAA.29.000313